basic
kernel
1 | check version |
boot
1 | list boot |
machine type
1 | # Is this bare metal or a VM? |
repo
centos/rocky
1 | centos/rocky |
ubuntu/debian
一般情况下,将
/etc/apt/sources.list或/etc/apt/sources.list.d/ubuntu.sources文件中 Ubuntu 默认的源地址http://archive.ubuntu.com/替换为http://mirrors.ustc.edu.cn/即可。
1 | sudo sed -i 's@//.*archive.ubuntu.com@//mirrors.ustc.edu.cn@g' /etc/apt/sources.list |
shell
1 | check shell |
user
1 | sudo权限用户切换成root |
hostname
1 | sudo hostnamectl set-hostname <new-hostname> |
env
1 | list env |
editor
config nano or vim as default editor
1 | select-editor |
crontab
1 | ┬──────── minute (0–59) |
swap
1 | temp |
top
1 | 1 - 查看所有CPU核的使用情况 |
进程CPU占用率
在 Linux 系统中,每个进程都只能在单个 CPU 核心上运行。但是,系统可以通过调度程序(scheduler)在多个 CPU 核心之间轮换运行进程,从而达到让多个进程同时执行的效果。
1
2
3
4
5
6
7
8us:用户态使用的cpu时间比
sy:系统态使用的cpu时间比
ni:用做nice加权的进程分配的用户态cpu时间比
id:空闲的cpu时间比
wa:cpu等待磁盘写入完成时间
hi:硬中断消耗时间
si:软中断消耗时间
st:虚拟机偷取时间
timezone
1 | timedatectl |
UTC(Coordinated Universal Time )是国际时间标准,通常与GMT相同,但在某些情况下,UTC可能会有闰秒的调整。
UTC is the global standard for timekeeping.
It does not observe Daylight Saving Time (DST).
Used as a reference for time zones worldwide.
Offset: UTC is the baseline, so its offset is 0 hours.
GMT(Greenwich Mean Time)是格林尼治时间,没有夏令时调整。
- GMT was historically the global time standard but has largely been replaced by UTC.
UTC+N or GMT+N
- In most practical cases, UTC+N and GMT+N are equivalent.
- Refers to a time zone that is N hours ahead of UTC (Coordinated Universal Time).
- UTC+N is the modern term and is more precise in technical or scientific contexts (e.g., aviation, computing, telecommunications).
- GMT+N is an older term that is still widely recognized but less commonly used in formal applications.
CST
CSTcan mean different things depending on the machine’s timezone setting. In many Asia-based Linux environments it means China Standard Time (UTC+8), e.g.Tue Apr 21 03:33:07 PM CST 2026
date
判断 day of year
doy=$(date +%j)制定日期减一天
date -d"20140101 -1 days" +"%Y%m%d"当前时间戳(秒)
1
date +%s
光标
1 | Ctrl+a:光标回到命令行首。 (a:ahead) |
GUI
browser GUI
Substitute
Press
Ctrl+I: This sends the exact same signal (ASCII code 9) as theTabkey. Use it to move the highlight toor . Press
Ctrl+M: This sends the “Carriage Return” signal, which functions exactly like Enter.Press
Ctrl+3: In many terminal emulators,Ctrl+3sends the ASCII escape character (^[) just likeESCdoes.Press
Alt+Space: Some browser terminals treat theAltkey as a “Meta” key, which sends an Escape signal before the next keystroke.Alt+Spacecan sometimes act asEscfollowed by a space, effectively triggering the escape behavior in some menus.
ssh
1 | step1: generate ssh-key in all nodes |
troubleshooting
Enter passphrase for key ‘/home/jenkins/.ssh/id_rsa’
1 | remove existed passphrase |
Received disconnect from xxx port 22:2: Too many authentication failures
Solution: Clear overloaded ssh-agent
1 | Check loaded keys |
firewall
ubuntu
check status :
sudo ufw statusenable firewall:
1
2
3$ sudo ufw enable
Command may disrupt existing ssh connections. Proceed with operation (y|n)? y
Firewall is active and enabled on system startupdisable firewall
1
2$ sudo ufw disable
Firewall stopped and disabled on system startup
rocky
disable firewalld
1 | sudo systemctl stop firewalld |
disk
查看系统磁盘占用情况
df -h查看目录下文件大小
du -sh查看当前目录下一级子文件和子目录占用的磁盘容量:
du -h --max-depth=11
2
3
4
5查看当前目录下user目录的大小,并不想看其他目录以及其子目录:
du -sh user
-s表示总结的意思,即只列出一个总结的值
du -h --max-depth=0 user
--max-depth=n表示只深入到第n层目录,此处设置为0,即表示不深入到子目录。总结
du常用命令du -h –max-depth=1 |grep ‘G’ |sort #查看上G目录并排序
du -h –max-depth=1 |grep [TG] |sort #查找上G和T的目录并排序
du -sh –max-depth=1 #查看当前目录下所有一级子目录文件夹大小清理指定目录下的文件
例如需要根据时间删除这个目录下的文件,/tmp,清理掉20天之前的无效数据。可以使用下面一条命令去完成:
1
2
3
4
5
6
7
8find /tmp -mtime +21 -name "*" -exec rm -Rf {} \;
- /tmp :准备要进行清理的任意目录
- -mtime:标准语句写法
- +10:查找10天前的文件,这里用数字代表天数,+30表示查找30天前的文件
- "*":希望查找的数据类型,".jpg"表示查找扩展名为jpg的所有文件,""表示查找所有文件
- -exec:固定写法
- rm -Rf:强制删除文件,包括目录(注意R大写,f小写)
- {} \; 固定写法,一对大括号+空格+\+;
Memory
OOM积分机制
OOM(Out-Of-Memory)积分机制是 Linux 内核在系统内存耗尽时,通过评估进程的优先级和内存使用情况,选择一个或多个进程终止以释放内存的一种机制。其核心目标是在内存不足时,最小化系统崩溃风险并优先保留关键进程。
OOM 积分机制的工作原理
oom_score计算
每个进程的oom_score(位于/proc/<pid>/oom_score)决定了它被 OOM Killer 选中的概率。分数越高,进程越可能被终止。计算依据包括:- 内存使用量:进程占用的物理内存和交换分区(Swap)的总和。
- 运行时间:长时间运行的进程可能被适当保护(通过
oom_score_adj调整)。 - 进程优先级:低优先级(高
nice值)的进程更易被终止。 - 子进程内存:父进程的子进程内存可能计入父进程的评分。
- 用户权限:特权进程(如 root 用户进程)可能被保护。
oom_score_adj调整因子
用户可通过/proc/<pid>/oom_score_adj文件(范围:-1000到1000)手动干预评分:- 负值:降低被终止概率(如
-1000表示免疫 OOM Killer)。 - 正值:增加被终止概率。
- 负值:降低被终止概率(如
调整 OOM 参数的常见方法
保护关键进程:
通过修改oom_score_adj降低其被终止的概率:1
echo -1000 > /proc/<pid>/oom_score_adj # 使进程免疫 OOM Killer
增大进程终止概率:
1
echo 500 > /proc/<pid>/oom_score_adj # 增大终止概率
process
1 | check specify process limit info |
check memory limit
1
2
3
4
5
6Get the Cgroup Path
cat /proc/<pid>/cgroup # eg. cat /proc/51683/cgroup
print
0::/system.slice/dingofs-mount.service
cgroup_path="/sys/fs/cgroup/system.slice/dingofs-mount.service"
cat "$cgroup_path/memory.max" # print bytes num
status
journalctl -u xxx.servicejournalctl -xe查看最近系统服务日志
usage
1 | ps -aux | grep 服务名称或pid |
Tree view all process
1 | pstree -g |
Verify Process Activity
| Method | Command to Run | What it Checks | Signs of Activity | Signs of Hanging/Stuck |
|---|---|---|---|---|
System Calls (strace) |
strace -p <pid> |
Real-time kernel interactions and I/O requests | Constant stream of read() and write() calls. |
Output stalls entirely, often stuck on select() or poll(). |
Disk I/O Stats (/proc) |
watch -n 1 cat /proc/<pid>/io |
Total bytes read/written by the process | read_bytes and write_bytes values continually increase. |
Values remain static over multiple seconds. |
Live Bandwidth (iotop) |
iotop -p <pid> |
Current disk read/write speeds. | Active MB/s or KB/s read/write speeds. | 0.00 B/s for both read and write. |
Kernel Stack (/proc) |
cat /proc/<pid>/stack |
The exact kernel function where the process is suspended | The output changes frequently upon repeated checks. | Persistently stuck on functions like do_select or nfs_wait_bit_killable. |
Open Files (lsof) |
lsof -p <pid> |
The specific files or network sockets currently in use. | Shows the active file. (Combine with ls -lh to see if file grows). |
File size/timestamp on the target file remains unchanged. |
install
略过gui提示
1 | DEBIAN_FRONTEND=noninteractive NEEDRESTART_MODE=l apt install -y xxx |
卸载安装的软件
1 | 浏览已安装的程序 dpkg --list |
安装deb文件出错时
使用apt-get -f -y install修复之后,再进行安装
1 | 1.执行命令sudo dpkg -i XXX.deb 返回依赖关系错误提示 |
centos安装离线依赖
1 | rpm -ivh name.rpm |
其他
剪切板
1 | 将剪切板中的内容输出到文件 |
securtCRT
1 | 下载服务器文件 sz filename |
system
kernel dumps
1 | Changing Kernel Crash Dump Directory (for kdump) |
core dumps
enable core dump file
check
1
2
3ulimit -c
0 means the maximum core dump file size is set to zero bytes, which completely disables core dump generation for the current shell and its child processes. 0 causes immediate skip—no core file written, regardless of kernel.core_pattern)
unlimited means unlimited core dump sizeenable core dump
temporary
1
ulimit -c unlimited
permanently
1
2
3vim /etc/security/limits.conf
* soft core unlimited
* hard core unlimited
config core dump file
1 | 方式一:(config permanently): |
| Feature | Kernel Dumps | Core Dumps |
|---|---|---|
| Source | Kernel crashes (kernel panic) | User-space process crashes |
| Trigger | Kernel panic | Process signals (e.g., SIGSEGV) |
| Contents | Entire (or partial) system memory | Process memory |
| Tools | kdump, crash | gdb, apport, ABRT |
| Debugging Scope | Kernel-level debugging | User-level application debugging |
| Location | Typically /var/crash | Specified by core_pattern (/proc/sys/kernel/core_pattern) |
time
running duration or uptime
1
2
3
4
5option 1
uptime
option 2
who -bchrony
1
2
3
4
5
6
7
8
9
10
11
12install
sudo dnf install chrony -y
sudo systemctl enable chronyd
sudo systemctl start chronyd
config NTP servers
sudo vi /etc/chrony.conf
server time1.aliyun.com iburst
server time2.aliyun.com iburst
server ntp.aliyun.com iburst
restart
sudo systemctl restart chronyd
version
查看系统
cat /etc/os-release
查看内核
cat /proc/versionuname -a
查看linux版本
lsb_release -acat /etc/issue
总核数 = 物理CPU个数 X 每颗物理CPU的核数
总逻辑CPU数 = 物理CPU个数 X 每颗物理CPU的核数 X 超线程数
查看物理CPU个数
- top命令,然后输入数字1查看,各项参数如下
us:用户空间占用 CPU 的百分比。sy:内核空间占用 CPU 的百分比。ni:调整过优先级的进程占用 CPU 的百分比。id:空闲 CPU 的百分比。wa:等待 I/O 的 CPU 时间的百分比。hi:硬中断(hardware interrupt)占用 CPU 的时间的百分比。si:软中断(software interrupt)占用 CPU 的时间的百分比。st:虚拟机或者运行在它上面的虚拟 CPU 占用 CPU 的时间的百分比。
- 输入mpstat查看
- 输入以下命令
1
cat /proc/cpuinfo| grep "physical id"| sort| uniq| wc -l
- top命令,然后输入数字1查看,各项参数如下
查看每个物理CPU中core的个数(即核数)
1
cat /proc/cpuinfo| grep "cpu cores"| uniq
查看逻辑CPU的总数
1
cat /proc/cpuinfo| grep "processor"| wc -l
清理内存
Pagecache (Value 1): This targets cached file contents from disk reads, making that memory available again without affecting filesystem metadata. Running it alone leaves slab caches intact, so less total memory gets reclaimed.
1
2Use 1 for lighter tuning focused on file data.
sync; echo 1 > /proc/sys/vm/drop_cachesFull Clear (Value 3): Value 3 combines pagecache with dentries (directory entries) and inodes (file metadata), clearing more cache types for greater memory release. Both operations skip dirty data and work best after sync to flush changes to disk first.
1
2Use 3 when needing maximum free memory from caches.
sync; echo 3 > /proc/sys/vm/drop_caches
查看buff/cache
best practices
排查硬件问题
rasdaemon stores errors in a SQLite database on disk, so they persist across reboots.
rasdaemonlistens to kernel hardware error events (MCE/EDAC/AER) and writes them into/var/lib/rasdaemon/ras-mc_event.dba crash alone does not guarantee an entry in rasdaemon’s DB; only specific hardware error events that reach its tracepoints will update
ras-mc_event.db.
1 | 1. Install the package |
service
1 | # check specify config. e.g. |
auto restart
1 | # check auto restart |
troubleshooting
鼠标按键会在终端输入乱码
1 | the `reset` command helps restore the terminal to a known good state, which can be helpful in troubleshooting issues or clearing screen clutter. |
Too many authentication failures
received disconnect from x port 22:2: Too many authentication failures
1 | Remove all keys from the agent |
/etc/hosts 文件无法编辑
1 | the file may have the immutable attribute set. Check with: |
Cannot create a temporary file
Cannot create a temporary file /var/tmp/sclhOLz2G: No space left on device
1 | 现象 |
root filesystem xxx UNEXPECTED INCONSISTENCY; RUN fsck MANUALLY
issuse
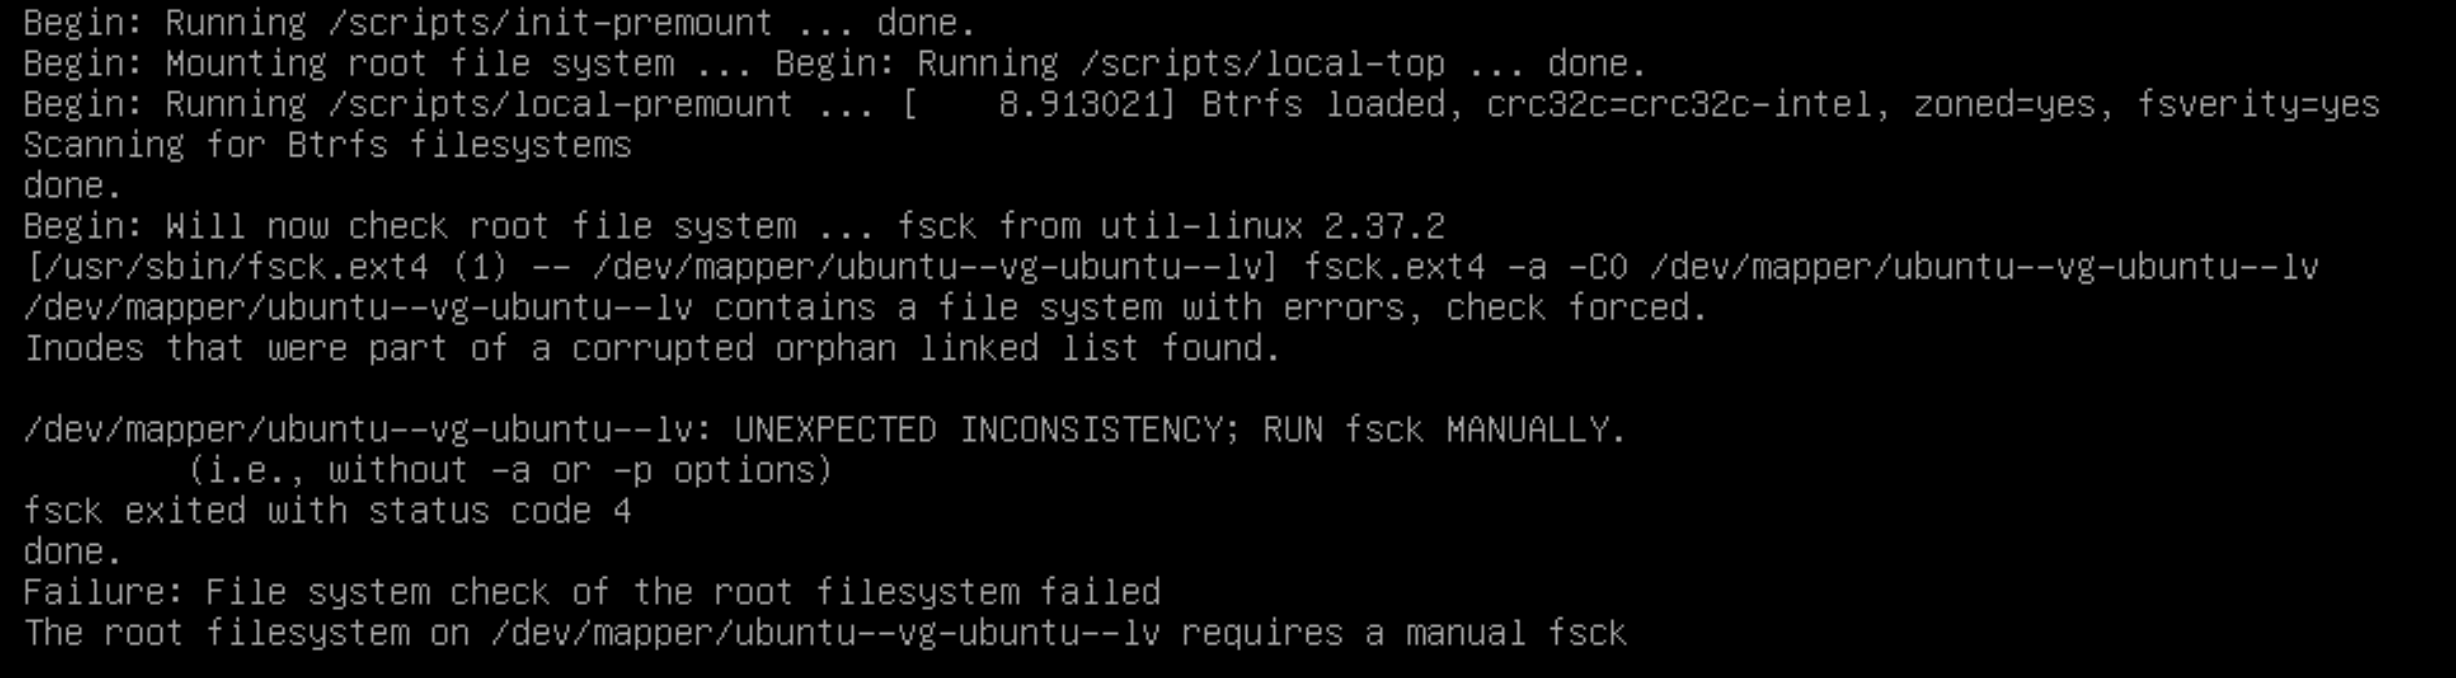
resolve
1
2
3
4
5fsck /dev/mapper/ubuntu--vg-ubuntu--lv
When prompted, type y to accept each fix suggestion, or a to fix all.
Once fsck completes successfully, reboot the system:
exec reboot -f
A fatal error was detected on a component at bus 0 device 2 function 0.
locate the root cause
1
2
3
4
5
6
7
8check previous boot time
journalctl --list-boots
.e.g.
-1 14737a98ed604f8b8dcfc5979b650b95 Thu 2026-02-26 16:21:43 CST—Thu 2026-03-05 15:40:50 CST
0 7f7498d4ddad4560a0b0550389be76d3 Thu 2026-03-05 15:45:27 CST—Thu 2026-03-05 16:33:10 CST
locate the roote cause
journalctl -b -1 -n 100identify what device is at
bus 0 device 2 function 0:1
2
3
4lspci -s 00:02.0
e.g. console print
00:02.0 PCI bridge: Intel Corporation Xeon E7 v4/Xeon E5 v4/Xeon E3 v4/Xeon D PCI Express Root Port 2 (rev 01)list all PCI devices hierarchically and see what’s attached behind the 00:02.0 bridge:
1
2
3
4
5
6
7
8
9
10
11
12
13lspci -t -vv
e.g. console print
\-[0000:00]-+-00.0 Intel Corporation Xeon E7 v4/Xeon E5 v4/Xeon E3 v4/Xeon D DMI2
+-01.0-[02]----00.0 Broadcom / LSI MegaRAID SAS-3 3108 [Invader]
+-02.0-[03]----00.0 Samsung Electronics Co Ltd NVMe SSD Controller S4LV008[Pascal]
+-03.0-[01]--+-00.0 Broadcom Inc. and subsidiaries BCM57412 NetXtreme-E 10Gb RDMA Ethernet Controller
...
Explanation
The PCIe fatal bus error you previously saw (bus 0 device 2 function 0) corresponds to:
- A PCIe root port (00:02.0)
- Leading to a Samsung NVMe SSDcheck NVMe Devices to PCIe Slots
1
2
3
4
5
6ls -l /sys/block/ | grep nvme
e.g. console print
lrwxrwxrwx. 1 root root 0 Apr 22 14:18 nvme0n1 -> ../devices/pci0000:00/0000:00:02.0/0000:03:00.0/nvme/nvme0/nvme0n1
lrwxrwxrwx. 1 root root 0 Apr 22 14:18 nvme1n1 -> ../devices/pci0000:00/0000:00:03.2/0000:04:00.0/nvme/nvme1/nvme1n1
lrwxrwxrwx. 1 root root 0 Apr 22 14:18 nvme2n1 -> ../devices/pci0000:80/0000:80:02.0/0000:82:00.0/nvme/nvme2/nvme2n1
other check
check drive health
1
nvme smart-log /path/to/device # e.g. nvme smart-log /dev/nvme0
check again for PCIe or I/O errors
1
dmesg | grep -iE "nvme|pcie|error"
Permission denied (publickey)
check target server
/etc/ssh/sshd_configshould config below value1
2
3PermitRootLogin yes
PubkeyAuthentication yes
AuthorizedKeysFile .ssh/authorized_keysavailble modify value
1
systemctl reload sshd